Map Data Visualization
This post is about what I have learned about visualizing data from 2019nCov-api. In order to visualize the data I will need to get the latitude-longitude reference. And I found two interesting APIs. Baidu Map vs Google Map.
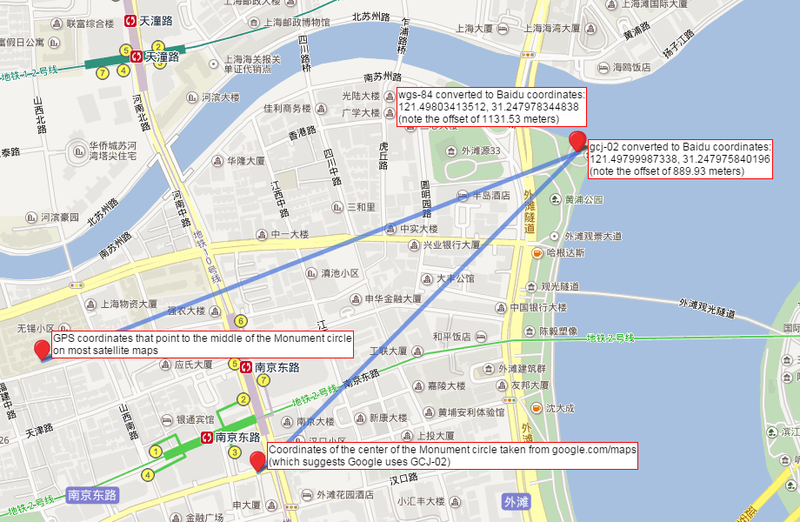
The coordinate systems is actually quite interesting. Baidu Maps uses a variant of web Mercator projection for slicing map data into tiles with an underlying latitude-longitude reference - BD-09 coordinate system while the Chinese government is using GCJ-02. And the rest of the world is using WGS-84. The picture below showed the difference between those 3 coordinates systems.
为了把新冠疫情爬虫数据可视化,我去研究了一下如何把数据加在地图上。然后发现了神奇的坐标体系百度坐标(BD09)、国测局坐标(火星坐标,GCJ02)、和WGS84坐标系。👇这张图就是把同一个坐标下的三个坐标的区别。不过看到国测局的坐标系被称为火星坐标,还是忍不住笑出来了😂。
👆This picture makes me want to compare Google Direction API with Baidu Direction API by drawing the same direction line on a map. 我灵机一动准备用同样的方法来比较一下谷歌地图API和百度API.
[ Baidu Direction API vs Google Direction API ] - [ 百度地图API vs 谷歌地图API ]
百度地图API接口:
api endpoint: http://api.map.baidu.com/directionlite/v1/driving
谷歌地图API接口:
api endpoint: https://maps.googleapis.com/maps/api/directions/
You can retrieve GCJ-02 coordinate from baidu api by setting ret_coordtype=gcj02. 百度地图的接口也可以将坐标系设为GCJ-02.
Let’s check the path from Chongqing to Beijing.
Google and Baidu recommended different paths. If you zoom in you will find GCJ-02 is a little bit different from BD-09. 百度和谷歌建议的路线不一样, 火星坐标和百度坐标又不一样👇
Let’s look at another question - how to draw a curved flight path

import math
from geographiclib.geodesic import Geodesic

 points = []
    # travel by flight
    if type == 1:
        geod = Geodesic.WGS84
        lat_0, lng_0 = geoLocation(s_city)
        lat_1, lng_1 = geoLocation(e_city)
        l = geod.InverseLine(lat_0, lng_0, lat_1, lng_1)
        ds = 100e3; n = int(math.ceil(l.s13 / ds))
        for i in range(n + 1):
            if i == 0:
                print("distance latitude longitude azimuth")
            s = min(ds * i, l.s13)
            g = l.Position(s, Geodesic.STANDARD | Geodesic.LONG_UNROLL)
            points.append([g['lat2'],g['lon2']])
🗺️ Have Fun Mapping 🗺️
Please feel free to leave some comments if you have any questions or have any other interesting use cases. If you have enjoyed reading this post, please feel free to buy me a (r'virtual|physical', 'coffee'). All the coffee from #2019nCov posts will be donated (if there are any).